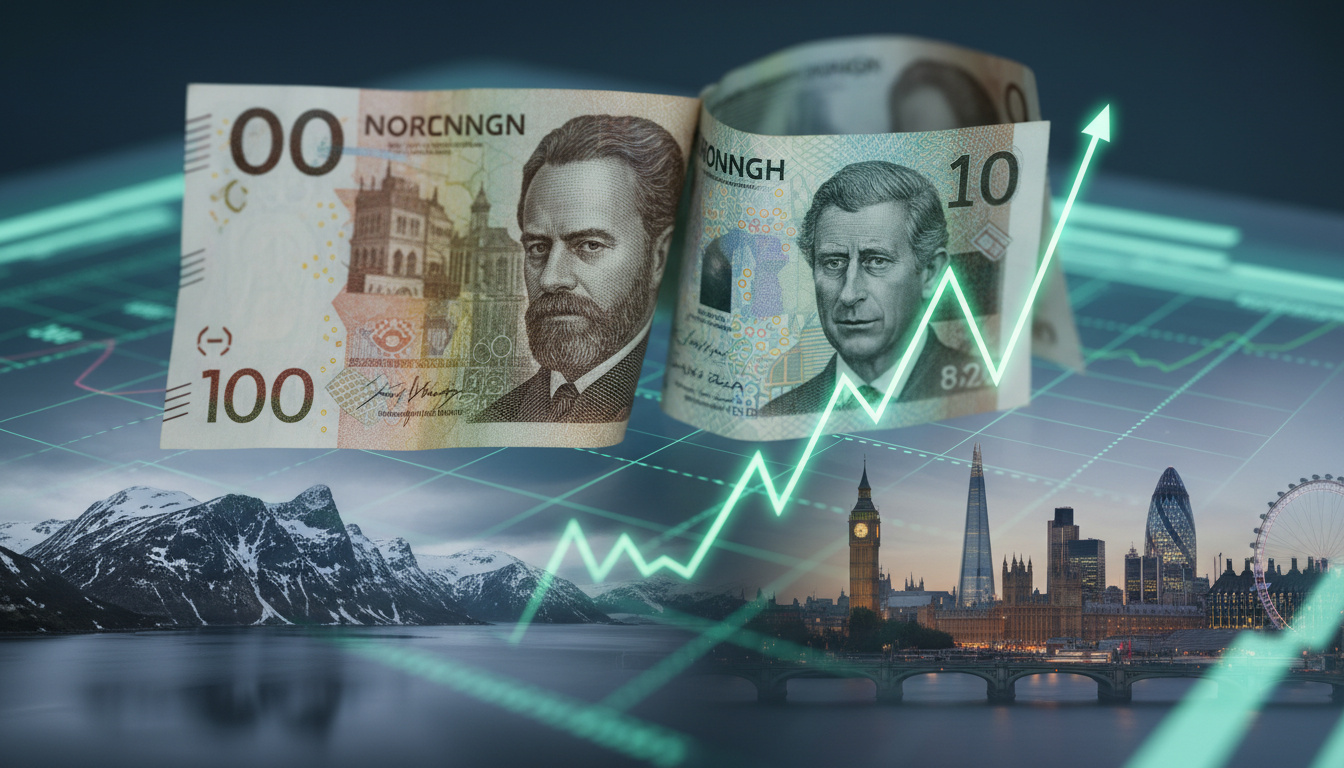
The Norwegian Krone to GBP exchange rate currently hovers near 0.077 British Pounds per Krone, reflecting continuous fluctuations in global currency markets. As of early April 2026, data from multiple mid-market sources positions the rate between 0.075 and 0.078 GBP per NOK, with specific figures varying slightly between providers.
For travelers, expatriates, and businesses engaged in Norway-UK transactions, understanding these movements proves essential. The pair has shown a yearly appreciation of approximately 4.59% according to Trading Economics data, yet short-term volatility remains a constant feature, with the largest single-day drop reaching -0.252% on October 31, 2025.
This analysis examines current valuations, historical trends, conversion methodologies, and the economic mechanisms driving fluctuations between these two currencies.
What is the Current Norwegian Krone (NOK) to GBP Exchange Rate?
- Current valuations: 1 NOK converts to approximately 0.077 GBP, though live rates vary between 0.07520 and 0.07795 depending on the provider.
- Inverse calculation: 1 British Pound currently purchases roughly 13.0 to 13.3 Norwegian Kroner.
- Yearly trend: The Krone has strengthened against Sterling by 4.59% over the past 12 months according to Trading Economics.
- Monthly decline: Despite yearly gains, the rate has retreated by 0.10% over the past 30 days.
- Weekly stability: Recent seven-day periods show minimal movement, ranging between +0.06% and +0.205%.
- Provider variance: Revolut recorded a daily change of +3.24% recently, while Wise reported a more modest +0.006% shift.
- October volatility: The most significant recent single-day movement occurred on October 31, 2025, with a drop of -0.252%.
| Metric | Detail |
|---|---|
| NOK Symbol | kr |
| GBP Symbol | £ |
| Norway Central Bank | Norges Bank |
| UK Central Bank | Bank of England |
| Trading Economics Rate | 0.07735 GBP |
| Revolut Rate (April 2026) | 0.07520 GBP |
| Wise Rate (April 2026) | 0.07795 GBP |
| Investing.com Rate | 0.07755 GBP |
| ExchangeRates.org.uk (April 3, 2026) | 0.07751 GBP |
What is the Historical NOK to GBP Exchange Rate?
Historical data spanning from 1975 to 2026 from the Bank of England provides extensive context for the NOK/GBP relationship. This long-term dataset reveals how the pair has responded to oil crises, monetary policy shifts, and geopolitical events over five decades.
12-Month Highs and Lows
The Norwegian Krone reached its one-year peak against Sterling on February 18, 2026, touching £0.078 according to Traders Union. Conversely, the currency tested support levels near £0.0748 to £0.0750 during late October 2025, marking the lowest valuations in the current 52-week window.
Interactive Chart Availability
Multiple platforms offer detailed historical visualization. Xe and Wise provide interactive charts extending up to five years, utilizing mid-market rates. Bank of England historical reference rates offer institutional-grade data back to 1975.
Historical records include specific 180-day datasets from May 4, 2025, to October 29, 2025, allowing detailed analysis of recent volatility patterns. Users can access charts ranging from 7-day snapshots to 270-day views or longer historical periods dating back to 2010.
Why Does the NOK to GBP Rate Fluctuate?
Currency movements between the Krone and Pound stem from a complex interaction of commodity markets, central bank policies, and bilateral economic conditions. However, current publicly available search data lacks specific details on recent oil price correlations, interest rate decisions by Norges Bank, or direct Brexit impact assessments.
Economic Drivers
Norway’s status as a major oil exporter traditionally links Krone strength to crude market performance. When oil prices rise, the NOK typically appreciates against Sterling. Conversely, UK economic indicators, including Bank of England base rates and post-Brexit trade dynamics, exert downward or upward pressure on the cross-rate.
Market Volatility
The largest recorded single-day movement in recent months occurred on October 31, 2025, when the pair dropped 0.252% within 24 hours. Such fluctuations reflect immediate reactions to economic announcements, often before underlying fundamental analysis becomes widely available.
How to Convert Norwegian Krone to British Pounds?
Executing conversions at favorable rates requires understanding the distinction between mid-market pricing and retail bank offerings. The mid-market rate represents the real wholesale exchange rate without markup, serving as the benchmark for fair valuation.
Mid-Market vs. Bank Rates
Banks and traditional providers typically add fees or margins above the mid-market rate, resulting in less favorable terms for consumers. In contrast, digital platforms like Revolut and Wise offer rates approaching mid-market levels, updating live throughout trading hours.
Bank transfers often include hidden markups that can cost 3-5% more than mid-market rates. Always verify the offered rate against live mid-market data before confirming transactions. If you’re looking for a camper van for sale in Norwich, you can find options at $Camper van for sale Norwich.
Timing Considerations
Given documented volatility, such as the -0.252% swing in October 2025, monitoring rates through interactive charts can improve timing. ExchangeRates.org.uk provides historical context to inform decisions on whether current levels represent favorable entry points.
Check rates immediately before converting or sending funds, as prices update every 60 seconds during market hours. For large transfers, consider splitting transactions to average out daily volatility.
What Key Events Have Shaped the NOK to GBP Rate Recently?
- October 31, 2025: Largest 24-hour drop recorded at -0.252%, marking significant volatility.
- Late October 2025: 1-year low established at approximately £0.0748-0.0750 per NOK.
- May 4 – October 29, 2025: 180-day historical data period captured by Wise analytics.
- February 18, 2026: 1-year high reached at £0.078 per NOK.
- April 3, 2026: ExchangeRates.org.uk records rate at 0.07751 GBP (high 0.07775, low 0.07734).
- 1975-2026: Bank of England maintains continuous reference rate history for the pair.
What Do We Know and Not Know About Future NOK to GBP Movements?
Established Information
- Mid-market rates consistently trade between 0.075 and 0.078 GBP per NOK as of early April 2026.
- Historical volatility data confirms daily fluctuations occur regularly, with movements exceeding 0.25% in a single day.
- Year-over-year data demonstrates a 4.59% appreciation trend for the Krone.
- Bank of England and Norges Bank policies fundamentally influence the exchange rate.
Remaining Uncertainties
- Specific Q2 2026 forecast figures remain unpublished; Trading Economics notes a forecast exists but provides no specific numerical target.
- Precise timing and magnitude of upcoming central bank interest rate decisions.
- Immediate impact of current oil price movements on near-term Krone valuation.
- Specific volume data for retail NOK/GBP trading activity.
What Underpins the Norway-UK Currency Relationship?
The exchange rate reflects broader economic realities between a resource-exporting Nordic nation and a services-oriented global financial center. Norway’s petroleum sector generates significant foreign currency inflows that traditionally support Krone valuations, while the United Kingdom’s economic performance, inflation metrics, and monetary policy decisions drive Sterling demand.
Post-Brexit trade arrangements continue to influence cross-border capital flows, though specific current impacts on the NOK/GBP rate remain undetailed in available research. The pair operates within the broader G10 currency framework, responding to global risk sentiment and regional economic divergences. For related consumer guidance regarding UK delivery services and compensation rights, see Evri Empty Box Delivery – Claims and Compensation Guide.
Where Does This Data Come From?
Market data derives from institutional and retail foreign exchange platforms operating under regulatory supervision. Trading Economics aggregates macroeconomic indicators, while Investing.com provides real-time pricing feeds. Wise and Revolut offer consumer-facing rate histories derived from mid-market wholesale data.
Bank of England historical GBP/NOK reference rates span 1975-2026, providing the longest available institutional dataset for this currency pair.
Bank of England via Pound Sterling Live
What Should You Remember About NOK to GBP Exchange?
The Norwegian Krone currently trades near 0.077 against the British Pound, having appreciated 4.59% over the past year despite recent monthly declines. For optimal conversion rates, utilize platforms offering mid-market pricing rather than traditional banking services, and monitor the Norwegian Krone to GBP – Current Rate and Trends for real-time updates before executing transfers.
Frequently Asked Questions
Is the Norwegian Krone stronger than the GBP?
No. One British Pound purchases approximately 13 Norwegian Kroner, meaning GBP maintains significantly stronger purchasing power against NOK.
How much is 100 NOK in GBP?
At current mid-market rates, 100 Norwegian Kroner converts to approximately £7.49 to £7.80, depending on the specific provider and timing.
How much is 1000 NOK in GBP?
One thousand Norwegian Kroner typically converts to roughly £75 to £78 based on current rates between 0.075 and 0.078 GBP per NOK.
Why do Revolut and Wise show different NOK to GBP rates?
While both use mid-market benchmarks, slight variations reflect different data feed sources, update frequencies, and proprietary spreads. Wise recorded 0.07795 GBP recently while Revolut showed 0.07520 GBP.
What was the lowest NOK to GBP rate this year?
The one-year low occurred in late October 2025, when the rate dropped to approximately £0.0748 to £0.0750 per Norwegian Krone.
How can I track historical NOK to GBP rates?
Interactive charts are available through Xe, Wise, and Revolut, offering views from 7 days up to 5 years. ExchangeRates.org.uk provides daily historical tables.
Related stories





George Pemberton is Consumer & Gaming Correspondent at ScopePress.uk, covering gaming, smart home and connectivity.